Taking Chances: Probability and the Fall of Argenport

Hi, jez2718 here again with another article on using probability to inform deck building. In my last article I introduced the framework for calculating deck building probabilities, and looked at some basic questions you can inform via probability. In this article we’ll be building on that (so if you haven’t read the last article, I recommend reading it first) to look at evaluating a couple of strategies made relevant by spoiled Fall of Argenport cards.

“Discard is consistency” and pre-boarding

To the consternation of many competitive players (including me) Scarlatch commented the other week that DWD intends to use the market as a stand-in for side boarding in official organised play events. Resheph and I are in the process of writing an article quantifying the relative impacts of sideboarding vs. markets in a best of three, but there are certain things that you simply cannot do with markets. Notably, the earliest you can play a market card is turn 4.

We’ve been seeing a bit of a dry spell for fast aggro the last few months, but anyone who remembers back to when Rally decks (or earlier, Jito decks) were prevalent on ladder will know that some decks can simply kill you by turn 4. So the market is not a reliable saviour against these sorts of decks. A possible solution to this is to pre-board against such matchups, i.e. running in your main deck powerful but narrow cards like Lightning Storm for a prevalent matchup.

The weakness of pre-boarding of course is it dilutes your deck and reduces consistency. Drawing a Lightning Storm vs Big Combrei or Unitless makes you feel silly. This is where discard effects can come in. I here use “discard” in a loose sense of anything that trades a card in your hand for another card or a powerful effect: so alongside looters such as Nocturnal Observer and similar cards like the recently spoiled Lumen Attendant, I also here refer to effects like Strategize and, importantly, Merchants. The motto “discard is consistency” highlights that these sorts of effects can boost the consistency of your deck by converting dead cards into gas. So we ask the question:

How many discard effects do I need to get away with running situational cards?

Let us consider the specific case of Lightning Storm. Suppose that fast aggro decks are, say, 20% of the meta, and that if you don’t draw a Lightning Storm by turn 3 your deck struggles vs these decks. Suppose the other 80% of the time the card is basically dead.

To reliably draw the Lightning Storm by turn 3, you really need to be running 3 or 4 copies of the card (with probabilities of 32% and 40% on the play respectively). Let’s say you run 3, after all this is a sideboard card, so you don’t want to dilute your deck too much, and you might still want one in the market.

The question is, how many discard effects should I run so that I can be confident of not drawing fewer discards than Lightning Storms on turns say 2 through 8? The probability of this on turn N with D discard effects is given, in the notation of my previous article, by the formula:

\sum_{i=1}^{3} \text{HG}(75,3,6+N,i,=)\text{HG}(72,D,6+N-i,i,<)

Recall that the first term of this is the (hypergeometric) probability of drawing exactly i Lightning Storm, and the second term is the probability of drawing fewer than i discard effects given that we draw i Lightning Storm. Calculating this we find

Probability of drawing more Lightning Storms than discard effects (on the play) with 3 Lightning Storm in deck

Number of discard effects

Turn

2

3 4 5 6 7

8

1

26.5% 29.1% 31.5% 33.7% 35.9% 37.9% 39.9%
2 24.2% 26.2% 28.0% 29.7% 31.2% 32.6%

33.9%

3

22.0% 23.5% 24.9% 26.1% 27.1% 28.1% 28.9%
4 20.0% 21.1% 22.1% 22.9% 23.5% 24.1%

24.5%

5

18.2% 19.0% 19.6% 20.0% 20.4% 20.6% 20.7%
6 16.5% 17.0% 17.3% 17.5% 17.6% 17.6%

17.5%

7

15.0% 15.2% 15.3% 15.3% 15.2% 15.0% 14.8%
8 13.5% 13.6% 13.5% 13.4% 13.1% 12.8%

12.5%

9

12.3% 12.2% 11.9% 11.6% 11.3% 10.9% 10.5%
10 11.1% 10.8% 10.5% 10.1% 9.7% 9.2%

8.8%

11

10.0% 9.7% 9.2% 8.8% 8.3% 7.8% 7.3%
12 9.0% 8.6% 8.1% 7.6% 7.1% 6.6%

6.1%

Looking at these numbers, it seems just running the four Jennev Merchants still leads to a pretty good chance of having a dead Lightning Storm. To really use this strategy effectively, you probably want to be looking at more like 7, 8 or more discard effects. Still with say 4 Strategize, and with the fact that we’ve ignored the possibility of redrawing hands with Lightning Storm or shipping them with Crests, this strategy could well be a viable way to fight against fast aggro without a sideboard. Note the trade-off however. With 8 discard effects, 3 Lightning Storm and a 20% fast aggro meta: 6.5% of the time you draw a Lightning Storm on time and hose fast aggro, 10.5% of the time you draw a mostly dead card and the other 83% of the time nothing much happens. So if you’re employing this strategy, the card has to really have an impact when you want it, and the decks you want it for need to be sufficiently common.

Standards in Aggro

Last weekend, DWD spoiled the remaining four Standard/Tactic cards, and especially the Fire, Justice and Shadow ones raise an interesting question.

standards

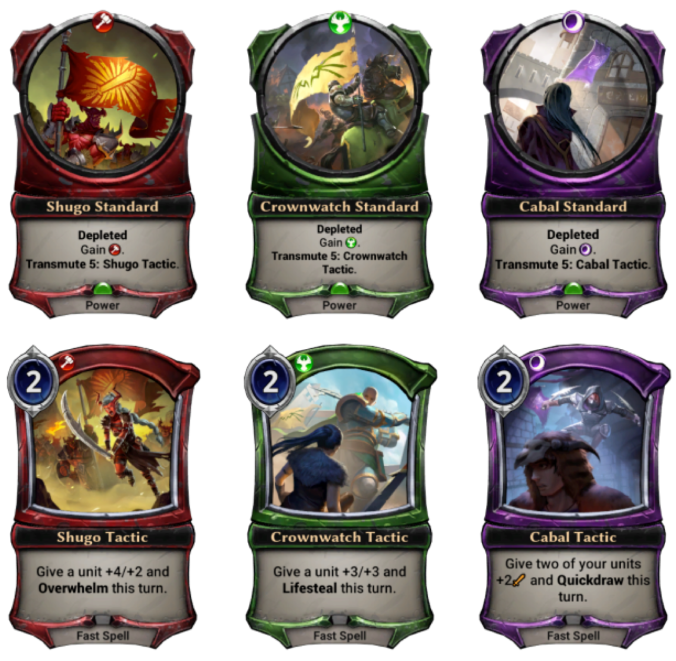
How many of these should you run in Aggro?

Obviously, the combat trick side of these cards is great. I think the Fire one is especially important, as by the time it transmutes Aggro will typically be trying to push for those final points of damage. And it helps that these don’t reveal their presence with pauses until they transmute. However, since an Aggro deck wants to always curve out, running more depleted power is a risk.

Now, questions like this are deceptively complicated. There are a lot of factors that go in to determining what your power should look like. So though we can use the techniques in my last article to find a few relevant probabilities, we must remember these tell only part of the story. Another approach, which we’ll touch on briefly, is to run simulations to save us very tricky calculations.

Some important probabilities

For simplicity, let us suppose our Aggro deck runs 25 Power: 4 Seats, 4 Banners, 0-8 Standards and the rest Sigils. Often a Stonescar deck might supplement this with a couple of Vara’s Favor, but for the purposes of curving out a Favor is very unlike even a depleted Power. Recent Rakano decks have been running exactly 25 sources, as did Sunyveil’s Stonescar at Worlds, so this isn’t unreasonable.

Probability of having undepleted power on curve on turns 1, 2, 3

This probability is the probability of drawing at least X power on turn X, at least one of which is undepleted Power. We can count Seats as depleted (as if you drew an undepleted seat, you already drew a undepleted Power). On turn 1 Banners are depleted (Infernus is a bad card!), and are only undepleted on turn 2 if you drew another undepleted source. We’ll assume they’re undepleted on turn 3 however. So if we run S standards, we have 17-S undepleted sources in deck on turns 1 and 2 and 21-S on turn 3. Thus on turn X = 1,2 we calculate:

\sum_{i=X}^{6+X} \text{HG}(75,25,6+X,i,=)\text{HG}(25,17-S,i,1,\geq)

and on turn 3

\sum_{i=3}^{9} \text{HG}(75,25,9,i,=)\text{HG}(25,21-S,i,1,\geq)

where the first term is the chance of drawing exactly i power, and the second the chance that at least one of that power is undepleted. We find:

Standards Turn
1 2 3
0 84.9% 78.6% 63.4%
1 82.8% 77.4% 63.3%
2 80.5% 76.0% 63.2%
3 78.0% 74.3% 63.0%
4 75.2% 72.3% 62.6%
5 72.1% 69.9% 62.2%
6 68.7% 67.3% 61.5%
7 64.9% 64.2% 60.7%
8 60.8% 60.6% 59.7%

Probability of drawing 5 non-Standard Power and a Standard

This tells how often the standard will actually be worth it, since you don’t really want to be relying on your other standards to get your Tactics on line. The probability is relatively simple. On turn N:

\sum_{i=5}^{5+N} \text{HG}(75,25-S,6+N,i,=)\text{HG}(50+S,S,6+N-i,1,\geq)

Probability of drawing 5 non-Standard power and a Standard
Standards Turn
5 6 7 8
1 2.6% 4.0% 5.8% 7.8%
2 4.3% 6.6% 9.5% 12.9%
3 5.2% 8.1% 11.6% 15.8%
4 5.5% 8.6% 12.5% 17.1%
5 5.4% 8.5% 12.4% 17.1%
6 5.0% 8.0% 11.7% 16.2%
7 4.5% 7.1% 10.6% 14.7%
8 3.8% 6.1% 9.1% 12.8%

Probability of undepleted Power on curve on turns 2 AND 3

This is made harder by the way Seats work. It can be calculated exactly, but the calculations are a bit too messy for this article. Instead we can estimate more easily with a simple simulation: we shuffle a deck of 75 cards (50 non-power, 4 Banners, 4 Seats, S Standards and 17-S Sigils) thousands of times, and count how often we have undepleted Power on curve. We can even incorporate the redraw rule into our shuffle if we please.

Standards Probability of undepleted Power on curve turns 2 and 3 (estimate from 10,000 shuffles each)
0 53.4%
1 52.6%
2 51.8%
3 50.0%
4 49.1%
5 47.5%
6 45.0%
7 42.5%
8 40.2%

Simulations in a goldfish bowl

A good metric for the quality of an Aggro list is the “average goldfish kill”, i.e. the average number of turns it takes for the deck to kill an opponent who does literally nothing. Finding the exact effect of running some number of Standards on this quantity would be a hell to calculate. But if you wanted, you could estimate this more easily by running simplified simulations. For example, one could consider a deck with an Aggro-like curve of vanilla X/X for X, 25 Power, some (0 to 8) of which are Standards that turn into “deal 4 damage” spells for 2, and then test a couple of thousand shuffles for their average goldfish kill for each amount of standards.

Wrapping up

Set 4 is shaping up to be an interesting set, raising various questions for deck builders. Hopefully this article has shed some light on a couple of these questions. The full impact of Merchants in particular will be exciting, and keep your eyes out for an article by Resheph and myself on how markets compare to sideboards.

Finally, don’t forget that TGP hosts a “Casual Friday” tournament every Friday at 5 EDT!

Until next time,

jez2718

Taking Chances: A Guide to Using Probability in Deck Building

Hi, jez2718 here. As some of you may know, I am a mathematics PhD student and as Batteriez has occasionally let slip on Discord this has lead to team TGP blackmailing asking me to do probability calculations to inform various deck building choices that arise in Eternal.  So I thought I’d write an article about the basic techniques that I’ve been using.

What do these calculations achieve?

It’s important to remember what we are and aren’t doing here. The advantage of calculating probabilities is of course that it tells you what you should expect to happen, whilst it takes a lot of testing to be sure that the results of the testing aren’t just variance.

But we must remember two things. First, a probability is just a number. It informs your decision of whether to play a card in your deck, but it doesn’t make that decision for you. Whether or not, say, a 66% chance of having the influence when you draw your splash card is worth the risk is a judgement that is going to take into account various other factors beyond just the maths.

Second, the probabilities we’ll be deriving will be approximations. Some of these approximations are for convenience: I’ll be assuming we draw cards truly at random, with no digital trickery to ensure 2-4 power in hand etc. This isn’t that hard to correct for, but it adds a bunch of messiness and my intuition is that it won’t make a huge difference in many cases. Other approximations are deeper though. Cards like Seek Power or Diplomatic Seal require the player to make choices. To fully account for these would elevate us from doing simple probability to designing a crude AI. Draw power like Wisdom of the Elders or Strategize obviously raise the chance of drawing into other cards, but to fully account for this involves conditioning on how many of each you draw, and crucially too whether we have the time to play them.

Thus to do this exactly would greatly increase the complexity of our calculations, and is it in the long run worth the effort? Instead we take shortcuts. We can treat Seek Powers and Diplo Seals as 3/4 or 2/3 of an influence. We can say that from testing we have, say, typically played one “Draw 2” spell before turn 5, so we model ourselves as having drawn 13 (or 14 on the draw) cards by turn 5 rather than 11 (or 12).

Six key numbers

As a TL:DR before getting into the meat of the method, following the great Yu-Gi-Oh! content producer Jason Grabher-Meyer here are “six numbers to make you a better duelist”: (the two numbers are ‘on the play’ and ‘on the draw’ respectively).

  1. Chance of opening with at least 1 of a card you run 4 of: 33%, 37%
  2. Chance of opening with at least 1 of 2 exact cards: 18%, 20%
  3. Chance of opening with at least 2 of a card you run 4 of: 4%, 5%
  4. Chance of opening with a 2-card combo running 4 of each: 10%, 13%
  5. Chance of opening with at least 1 of 6 target cards: 46%, 50%
  6. Chance of opening with 1 exact card: 9%, 11%

Hypergeometric probability

So, where do these numbers come from? The answer is an incredibly exciting sounding name for a rather mundane concept. In general, in Eternal you are sampling your deck without replacement. Thus if you draw a Power, that makes you slightly less likely to draw another Power, etc. This subtlety makes it kinda annoying to do these calculations by hand, for example the first probability above comes from:

1-\frac{71}{75}\times\frac{70}{74}\times\cdots\times\frac{65}{69}

But fortunately we don’t have to do this ourselves! Websites such as http://stattrek.com/online-calculator/hypergeometric.aspx provide an easy to use calculator for these probabilities (as does Microsoft Excel). So to find the first probability above, I put in a population of 75 (the deck size), with 4 successes in the deck, a sample size of 7 (8 on the draw) (i.e. the size of the starting hand) and the number of successes as 1. I then looked at the P(X≥1) output. We will simplify this by writing

\text{HG}(75,4,7,1,\geq)=0.330

This compact form will let us write more detailed formulae later for more advanced questions. Remember: you find HG(P,s,S,x,-) by putting those numbers into the calculator in order, and looking at the box indicated by the symbol.

Conditional probability

But wait, how did we find the 4th probability above? To do that, we had to find the probability of one thing happening AND another thing happening. As you may know, if these events are independent you can just multiply the two probabilities. But here drawing one combo piece is one fewer card in which to draw the other, so they aren’t independent. The general formula is:

\text{Pr}(A \& B) = \text{Pr}(A)\times \text{Pr}(B|A)

Where Pr(B|A) denotes the probability of B given that A has occurred. So the formula for the fourth probability is the more complicated expression:

\text{HG}(75,4,7,1,=)\text{HG}(71,4,6,1,\geq)+ \text{HG}(75,4,7,2,=)\text{HG}(71,4,5,1,\geq)+\text{HG}(75,4,7,3,=)\text{HG}(71,4,4,1,\geq)+\text{HG}(75,4,7,4,=)\text{HG}(71,4,3,1,\geq)

Before I explain what this formula is doing, let us introduce a way of writing this sort of expression more compactly. We can write this sum using the notation:

\sum_{i=1}^{4} \text{HG}(75,4,7,i,=)\text{HG}(71,4,7-i,1,\geq)

Where the Σ tells us to add up the terms inside it substituting the ‘i’ variable for 1,2,3 and 4 in turn. So here in each term the first HG is the probability of drawing exactly i copies of the first combo piece in the opening hand. We then look at the conditional probability. We’ve drawn every one of the first combo piece that we were going to draw, so our deck now behaves as a 71-card deck (i.e. without those cards), and our remaining hand has size 7 – i. We then attempt to draw at least one of our other combo piece with this hand. Finally, we sum over all the possibilities, i.e. over i = 1, 2, 3 and 4. Why do we sum the probabilities? This is our final tool, called the Law of Total Probability. It says that if a collection of events Ai are mutually exclusive (i.e. at most one of them can occur) and exhaust all the possible ways that an event B can occur, then:

\text{Pr}(B) = \sum_{i}\text{Pr}(A_i)\times \text{Pr}(B|A_i)

And that is actually all the formulae we need. Everything you want to do can be done by careful application of these ideas. For example if you want to find the probability of some event A on the redraw (with 25 power in deck) then you would use the Law of Total Probability and calculate:

\frac{1}{3}\sum_{i=2}^{4} \text{Pr}(A|i\text{ Power in opening hand})

A note on what to calculate

When deciding on whether to run a card, there are four basic cases

  1. You draw it and it is live. This is the best case scenario. If the card in question is some game-winning bomb, making this number large is typically what you want to do.
  2. You draw it and it is dead. For most cards, this is the most important number. Running blank cards is a bad idea, so you usually want to make this number as low as possible unless the card is really worth the risk.
  3. You don’t draw it and it would be live. This number basically governs whether a hate card is worth it. If the card is meant to be saving you from some major threat, then how often you die to that threat even with the card in deck matters.
  4. You don’t draw it and it would be dead. Meh.

Sometimes you might also want to compare these numbers. For example if a card is dead twice as often as it is live in the cases when you draw it, probably not a great card to include unless it is very powerful.

Example 1: How much Shadow does Makto need?

To illustrate how one might use this stuff to inform deck building choices, let us turn to a deck very close to my heart: JPS Nostrix. One of the primary strategies of this deck (when it isn’t getting hosed by In Cold Blood) is grinding out the opponent with Makto, preferably buffed up by Nostrix. However this is in tension with a number of other factors. Having Nostrix in the deck demands a lot of Justice and Primal, as does wanting Pacifier, Wisdom, Hailstorm and perhaps Valkyrie Enforcer live on turn 3. So we want to run enough Shadow to have SS when we need it, but otherwise not cut too much into our Justice and Primal (also for tempo reasons we can’t have too much depleted power). So we ask the following question:

What is the probability of drawing at least one Makto and less than two Shadow by turn 5?

Note that this isn’t the only question we could ask. We could ask about drawing Makto and only one J, or not drawing 5 Power. But in these cases, having a dead Makto in hand is the least of your worries. Finding the right question to ask is the true art here, and requires careful consideration.

We make some approximations. Let us treat the 4 Seek Power as 3 Shadow sources, and let us suppose that we usually draw two bonus cards by turn 5. So we have a sample of 13 cards. The decklist above has 15 shadow sources. Thus we calculate (on the play) a probability of

\sum_{i=1}^{4} \text{HG}(75,4,13,i,=)\text{HG}(71,15,13-i,2,<)

and this gives us the answer of about 12.6%. That is, a dead Makto on curve about every 1 in 8 games.  For context, the chance of drawing a Makto by turn 5 is 54%. Calculating for different numbers of Shadow sources gives:

Number of Sources

Probability of dead Makto

10

25.8%

11

22.7%

12

19.8%

13

17.1%
14

14.7%

15

12.6%
16

10.7%

17

9.0%

18

7.5%

Especially given the approximations we’d made (maybe 4 Seek Power really just counts as two sources, say, or if you don’t draw any card draw that game) we felt that 15 was a safer number than 14 given these numbers, the 17% from 13 felt too risky, whilst there was little real gain in going above 15 and potentially messing up things relying on JJ and/or PP. Were one feeling a little bolder though, one might wish to shave some of the shadow sources (perhaps to add in some of the upcoming Hooru Crests), and these numbers tell you how much risk that strategy would incur.

Example 2: Can you run Amilli in TJP Midrange?

As another question, let us turn to a (sadly for my pet Nostrix’s) more meta deck. Before the release of Svetya, the above was a bit of an important question. The received wisdom was no, so this lead to TJP having to run the kinda underwhelming Copperhall Elite. This issue was largely fixed by Svetya, but with many TJP lists running Mirror Image Amilli is still an attractive card. But of course, 5JJJ in a deck already notorious for mana issues is surely insane right? TL:DR It probably is indeed insane, but it is nice to check just in case you break the metagame. So we ask:

On each turn from 5 onwards, what is the probability (on the play) of drawing Amilli but not having 5JJJ?

This turns out to be a fair bit harder to answer than the Makto question, because whether you draw 5 powers affects your chance of drawing JJJ. We shall consider camat0/Tobboo’s deck from the invitational. This has 29 Power, and approximating Seeks as 3/4 of an influence and Diplo Seal as 1/2 an influence it has 20 Justice sources.

On turn N, one has drawn 6 + N cards on the play. Thus we have the formula, where A is the number of Amilli we run:

\sum_{i=1}^{A} \text{HG}(75,A,6+N,i,=)\text{Pr}(\text{No 5JJJ}|i\text{ Amilli})

To find the second probability, we need to use the Law of Total Probability a second time. Given that we drew exactly i Amilli, this is the same as drawing a hand of 6 + Ni from a deck of 75 – A cards. Given this, we have

\text{Pr}(\text{Draw 5JJJ}) = \sum_{P=5}^{6+N-i}\text{Pr}(\text{Draw }P\text{ Power})\text{Pr}(\text{3 of that }P\text{ Power is J})

and so

\text{Pr}(\text{No 5JJJ}|i\text{ Amilli}) = 1-\sum_{P=5}^{6+N-i}\text{HG}(75-A,29,6+N-i,P,=)\text{HG}(29,20,P,3,\geq)

So bringing this all together involves doing both sums. To do this, especially for all the different values of A and for N, it is best to use software like Excel (or MatLab etc. if you have access to them) to implement these formulae. The below table gives the answers:

Probability of Drawing a dead Amilli turns 5 through 8

Number of Amilli

Turn Number

5

6 7

8

1

10.3% 9.6% 8.7% 7.7%

2

19.0%

17.6% 15.8% 13.8%
3 26.4% 24.2% 21.6%

18.6%

4 32.6% 29.7% 26.2%

22.4%

So either you run so few Amillis as to not be worth it, or you have a really high chance of them drawing dead. Indeed, even the 1 Amilli plan is bad if you plan to cast it on curve: you have a 14.7% chance of drawing it by turn 5, and 10.3% of the time it is dead vs 4.4% it is live. So if you run one Amilli, it is with the intention of not drawing it until much later, which is not really why I’d want to be putting Amilli in TJP. For similar comparisons, a simple hypergeometric calculation gives:

Probability of Drawing an Amilli turns 5 through 8

Number of Amilli

Turn Number

5 6 7

8

1

14.7% 16.0% 17.3% 18.7%
2 27.4% 29.6% 31.9%

34.1%

3

38.3% 41.2% 44.0% 46.7%
4 47.7% 51.0% 54.1%

57.1%

NOTE: It is possible these numbers might not tell the whole story. If you look at the Hooru Fliers decks that preceded TJP, they ran very similar Power and Justice counts, yet also seemed to get away with running 4 Amilli. A large factor in all of this is that the redraw makes you more likely to have more Power, and by extension more influence. You might as an exercise want to apply the methods above to see if Amilli is more acceptably live on the redraw. But even if that is the case, it remains true that Hooru Fliers can afford to use the mulligan and target their Seek Powers to maximise the chance of a live Amilli. TJP on the other hand already has enough things to manage, and can’t really afford to mulligan with the goal of getting to 5JJJ.

Wrapping up

So I hope this has given a little insight into how one can use probability to approach deck building decisions in a bit of a more objective way, and will prove useful to you when you are tuning your own decks and want to know if say, a risky splash is worth it.

In other TGP news, keep an eye out for an announcement regarding an exciting new tournament we’re organising coming soon! And don’t forget, we also host a “Casual Friday” tournament every Friday at 5 EDT!

Until next time,

jez2718